How can you improve if you don’t measure progress?
This is why sales reports are an integral part of every business. They give you a clear picture of what’s working and what’s not while helping you make informed business decisions and improve your sales strategy.
Apart from meeting targets, sales managers are also expected to create and present reports to senior management and stakeholders, providing them with a detailed understanding of sales activity.
Sales reports are prepared on a daily, weekly, monthly, and yearly basis.
To write an effective sales report, you need to offer accurate insights while keeping readers engaged and interested. Today, sales reporting is evolving beyond static reports into real-time dashboards, predictive insights, and fully integrated systems.
What should a sales report include?
- Revenue (daily, weekly, monthly)
- Conversion rate
- Leads generated
- Pipeline value and velocity
- Average deal size
- Sales cycle length
- Top-performing channels or reps
How to Write a Sales Report
1. Set a goal.
2. Define a timeframe.
3. Collect relevant data.
4. Illustrate data visually.
5. Present your analysis.
6. Write a brief summary.
7. End with an action plan.
1. Set a goal.
Presenting a monthly sales report to the senior management is not the same as sharing a weekly report with the sales team. Both scenarios have a different audience and hence, demand a different approach.
The goal of a sales report depends on the audience you’re presenting to, which helps you decide what information is relevant to them.
So, before you write the sales report, narrow down the purpose and establish what you want to achieve from this report.
2. Define a timeframe.
Defining a timeline is important because it lets you present a more accurate and specific picture. It also gets easier to make comparisons, analyze trends, and come to logical conclusions.
For instance, if you’re working on a monthly report, there is no reason to look into data from the beginning of the year. Instead, you should focus on analyzing the sales performance for that month.
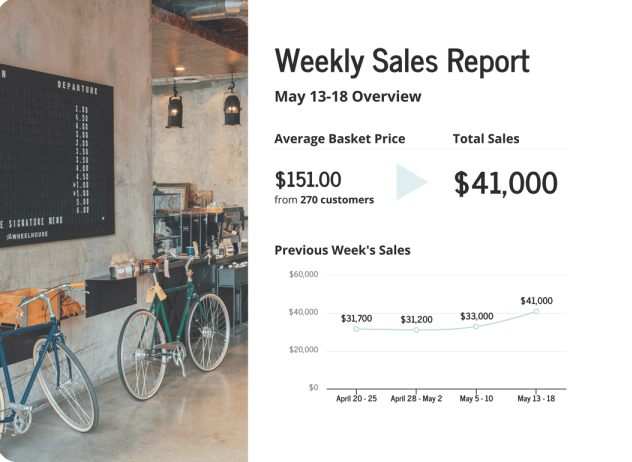
Source: Venngage
3. Collect relevant data.
Now that you’ve established the goal and timeframe, you need to gather the right data to form the basis of your sales report.
These are a few essential data points you can include:
- Calls made
- Leads generated
- Lead response time
- Deals won
- Conversion rate
- Revenue generated
- Deals won per sales representative
Instead of relying on static spreadsheets or one-time reports, modern sales teams use real-time dashboards to track performance continuously. These dashboards automatically update as new data comes in, allowing businesses to respond faster and make informed decisions in the moment.
According to research, companies lose between 15% and 25% of revenue annually due to data quality issues. That’s why it’s a good practice to maintain data hygiene by performing regular audits and weeding out poor or outdated data. Make sure you verify the accuracy of your sales data, as its absence will surely impact your analysis and reporting.
Additionally, one of the biggest challenges in sales reporting is disconnected data. When your CRM, marketing tools, and sales platforms aren’t integrated, reports can be incomplete or inaccurate.
For example, businesses often combine data from:
- CRM systems (customer interactions and deals)
- Marketing platforms (campaign performance and lead sources)
- Sales tools (calls, emails, and pipeline activity)
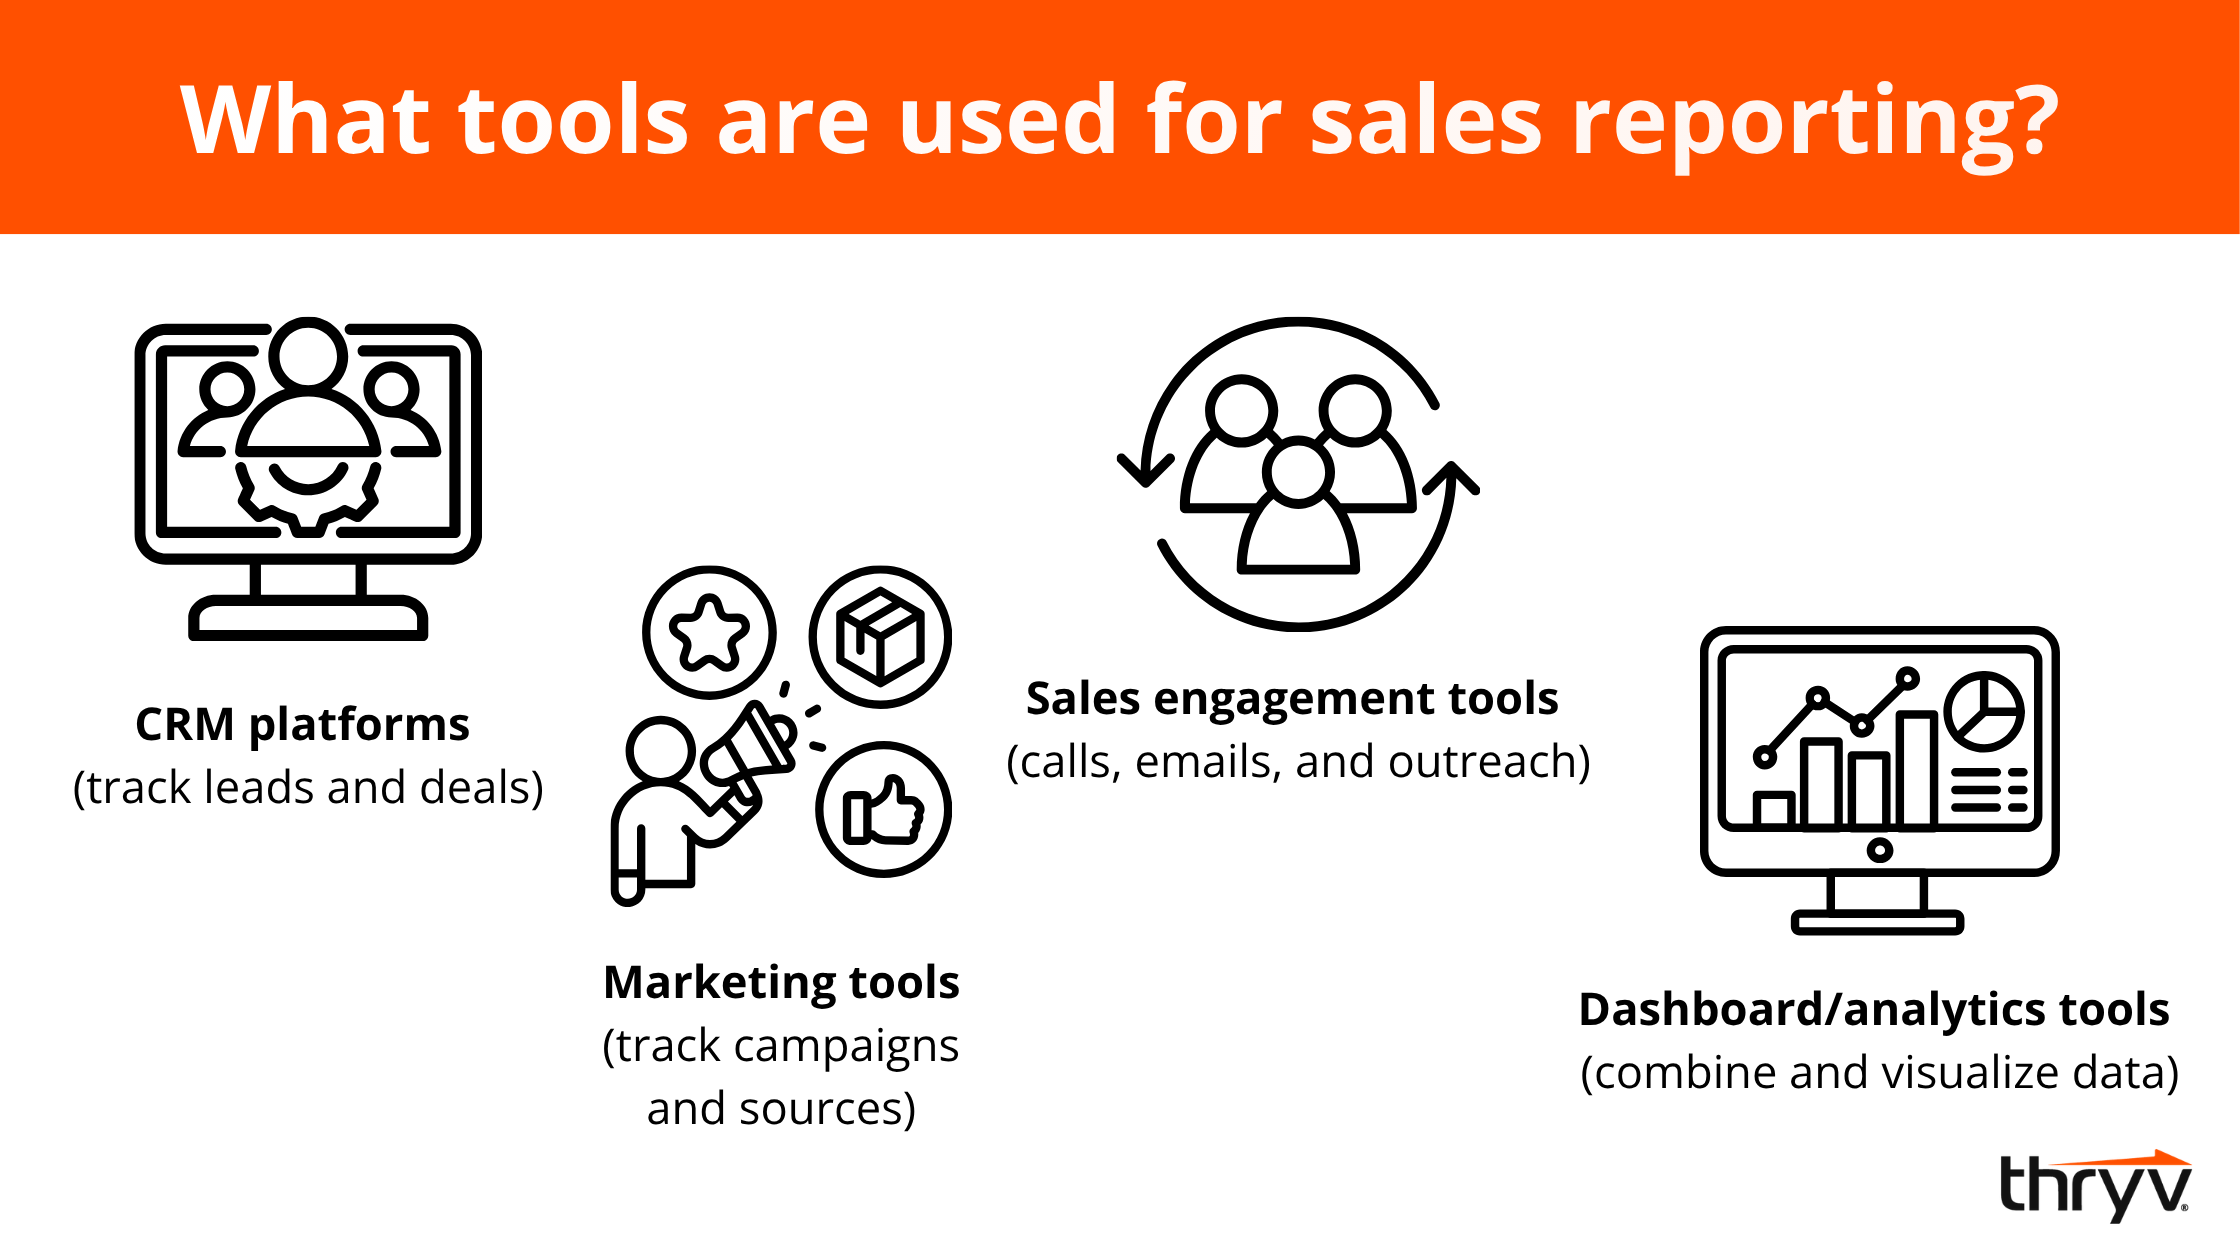
Bringing this data together allows for more accurate reporting and better decision-making.
Modern sales reporting relies on a single source of truth — a unified dashboard that pulls data from all systems into one place. This ensures consistency, improves accuracy, and gives teams a complete view of the customer journey.
By unifying CRM and marketing data in one place, Thryv enables more accurate forecasting and smarter decision-making, giving businesses a complete, real-time view of their sales performance.
4. Illustrate data visually.
Sales is a numbers game, but that doesn’t mean you can slap some numbers together and call it a sales report.
It’s important to tell a story with numbers and present them in an engaging way using visuals. Visuals are powerful because they communicate the message without overwhelming the reader.
You can leverage data visualization tools such as infographics, graphs, and charts to present your data. This makes it easier to digest information, identify trends, and emphasize key points.
Today’s sales reports go beyond basic charts. They include KPI dashboards that highlight the metrics that matter most, such as:
- Revenue performance
- Conversion rates
- Pipeline velocity (how quickly deals move through the funnel)
- Lead-to-close ratios
These dashboards provide a live snapshot of sales performance, making it easier to identify trends and act quickly.
To make data even more actionable, many businesses are turning to platforms like Thryv, which provide real-time dashboards that bring all key metrics in one place. Instead of manually compiling reports, you can instantly track leads, revenue, and campaign performance as they happen. This not only simplifies data visualization but also helps you quickly identify what’s working, spot trends, and make faster, more informed decisions.
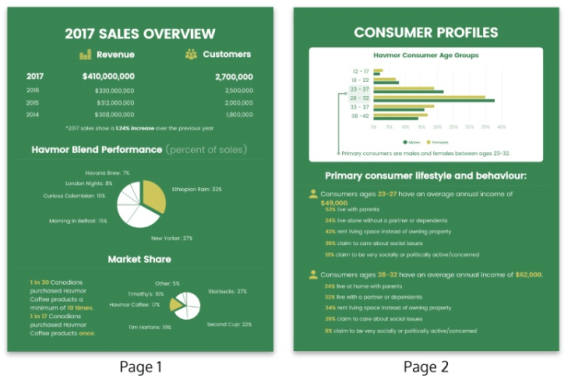
Source: Venngage
5. Present your analysis.
Collecting data is only the first step. The real value of a sales report comes from the insights you extract and the actions you take.
Whether you’re presenting to your subordinates or managers, they want to know your interpretation of the data presented. Analyze sales performance, assess patterns, and make comparisons to identify gaps in the sales process and uncover opportunities.
Instead of simply reporting numbers, focus on identifying trends over time. Are conversions increasing? Is pipeline velocity slowing down? Are certain channels consistently outperforming others?
It’s important to explain the reason behind the data you present and offer context so that people can make sense of the report and relate to it.
Modern sales reporting also includes forecasting, using historical data to predict future performance. This helps businesses plan ahead, allocate resources effectively, and set realistic goals.
Most importantly, every insight should lead to action. If a trend reveals a bottleneck or opportunity, your report should clearly outline what to do next.
How to analyze sales data
- Compare performance over time (week-over-week or month-over-month)
- Identify patterns or anomalies
- Segment data (by channel, rep, product, etc.)
- Look for bottlenecks in the sales funnel
- Use historical data to forecast future results
- Turn insights into clear action steps
6. Write a brief summary.
Starting the sales report with a brief, one-page summary is a good practice because it gives readers an overview of what they can expect. Make sure you highlight the timeframe and the key takeaways from the report in this section.
This is especially useful in cases where you’re presenting an in-depth report to top-level executives or the senior management who usually don’t have the time to read the entire report.
The summary doesn’t have to be text-heavy. Consider using visuals to present it and capture attention while sticking to a consistent color scheme.
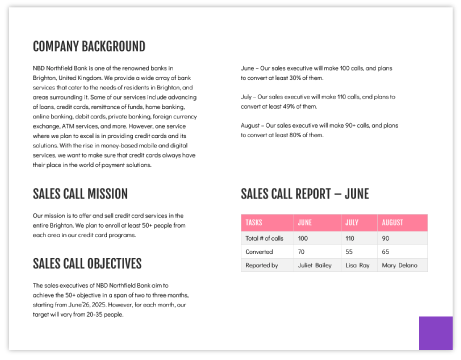
Source: Venngage
7. End with an action plan.
The best reports are action-oriented; they provide an action plan on the basis of the sales performance analysis.
For instance, if your sales are falling, it’s important to state a clear action plan that outlines your strategy for the coming weeks and how you plan to increase sales.
So, end your sales report with a definite action plan that addresses the gaps and loopholes. Not only does this shed light on your proactivity, but it also helps you hold your team accountable and track progress effectively.
From Sales Reports to Real Business Growth
Sales reports are important tools that aid decision-making, propel your team in the right direction, and drive performance.
However, reports have a bad rap for being dry and boring, but they don’t have to be that way. You can write reports that get the message across while keeping the audience engaged and interested.
So, apart from creating well-structured, accurate reports, it’s important to ensure they are an effective read by thinking creatively about how to present your sales data and analysis.

Modern Small
Business Playbook
Find expert tips and tools to help you streamline communications, automate your marketing efforts, improve your business operations, and more in this free guide.
FAQs
Q: How do you write a sales report?
A: To write a sales report, start by defining your goal and audience so you know what data matters most. Choose a specific timeframe, then collect key metrics like revenue, leads, and conversion rates. Present the data visually using charts or dashboards, analyze trends to explain what’s happening, and end with clear insights and an action plan. The most effective sales reports don’t just share numbers; they tell a story and guide next steps.
Q: What sales performance metrics should I measure?
A: The most important sales performance metrics include revenue, conversion rate, leads generated, pipeline value, and sales cycle length. You may also track pipeline velocity, average deal size, and lead response time to better understand efficiency. Together, these metrics provide a complete view of how your sales process is performing and where improvements can be made.
Q: What are the best business reporting tools?
A: The best business reporting tools bring all your data into one place so you can track performance in real time. Platforms like Thryv combine CRM, marketing, and sales data into unified dashboards, making it easier to monitor leads, revenue, and campaign performance without switching between systems. This kind of integration improves accuracy, saves time, and helps businesses make faster, data-driven decisions.